Where are we at?
What’s happening with the blume.table.Table?
My adventures in matplotlib land continue.
2024/01/02
Another year and still no table!
I have been using blume quite a lot with my main project, gotu. That is currently the best place to look for how I am using blume.
Adding the console has returned me to the REPL. The farm no longer pops up a matplotlib figure when it starts, you now have to type:
magic.show()
In the console to show the figure.
After that ‘r’ will run the current object, which can be obtained as:
cc = shepherd.current()
You can then manipulate attributes from the console and watch as it changes the plots.
If you find yourself wanting to run some co-routine, just call:
magic.runner(coroutine)
I have been using astropy quite extensively and am trying to build a generic viewer browsing astropy data using astropy’s Table objects.
2023/12/12
I have spent a lot of this year working with astropy and tables from the same. I mostly use the blume console now for running simple python programs that run magic.Ball objects in the blume.farm.Farm.
2023/1/1
The addition of the blume.console module has re-ignited my attempts to get web pages running pyodide up and running.
The latest approach, magic.html, aims to be a way to run blume in a browser. A matplotlib window and a simple console to control it all.
This is proving trickier than I had hoped, as python meets javascript in an asynchronous framework.
I have started to use the blume.magic.TheMagicRoundAbout to pass messages around in the system. It is likely a good time to get more information from the magic RoundAbout.
2022/12/9
I just added a Console module to the blume.magic module. It simply takes each line of input and sends it to the magic roundabout queue of the same name.
It uses asyncio.run_in_executor to run handle the calls to input.
2022/6/7
I have recently been trying to get blume running in a browser using Pyscript.
This project allows python and many packages to run in the browser.
I have been wanting to have some sort of blume running in the browser. Up to now, this meant having to run a webserver.
With pyscript, you just need static html and it downloads, builds and installs an entire python environment in a browser based virtual file system.
In order to get pyscript working I had to avoid libraries that it does not support yet.
One such package is curio. I had been using curio to run a loop for async python. It was curio that mad me brave enough to dip into the asynchronous world.
As I just needed an event loop, spawning of coroutines, sleep’ing and queues a switch to usin the asyncio from the python core is probably overdue.
I also removed networkx adding a simple DiGraph class to the blume.magic module to take its place.
You can find my current best effort at a working blume application in the browser.
There are lots of bugs and I am still figuring out the best way to go about building an interface. It also seems there are quite a few others working on similar ideas.
I gave a short talk about the background of blume and the early days of matplotlib.
Someone asked where blume might be in 5 years time.
It’s taken two years to this point, but the initial async code came from another project that is 3-4 year’s old.
It has been a time of evaluate options, different ways of working with axes and figures, thinking about what might be possible and exploring some of the inner workings of matplotlib.
I am hoping from here the core of blume, the magic and farm modules will simplify signifcantly.
One area I want to explore more is the whole area of event handling in the blume world. The bit I would really like to avoid is binding function names to keys, rather just have objects say, hey, I’ve got this cool function you could call
and let something else decide what actions trigger which callbacks. I just struggle of ways to do this that would not be annoying.
The goal is to have a stable core (blume.magic and blume.farm), that can be used in other projects, such as The Geometry of the Universe.
It does feel a major step forward in the project to be able to run examples in any modern browser, only having to serve static html. A full python environment on every mobile phone. One of the goals of the gotu project is to bring ideas to a wider audience and this very much helps with this.
Another question from today related to how the development process differs to that of the matplotlib project.
blume is very much a personal project, ideas are still evolving. It is almost certain things will break from one version to another as different ideas are explored. At the same time I am using it in other projects, such as gotu and karmapi, so I am starting to need stable releases of blume.
The primary focus is on a toolset for myself to explore data with python visualisations.
When I look back on software I have built over the years it has generally either been just for myself to run, or for a small team working closely together, rather than the tens of thousands of users that matplotlib has.
2022/4/2
I have now transferred the previous core to use the standard matplotlib figure manager to display everythng.
It comes with my attempts at an interface.
Think of it like an adventure game.
Pressh h for help and check the console for what key does what.
Typically examples have a number of magic.Ball objects added to the farm.
The Balls have a run coroutine that typically waits for an matplotlib Axis object.
To make everything work, these Axes are wrapped in a blume.farm.Axe, which allows all sorts of hacks, such as setting setting the Axes location to that of some other Axis to allow us to move things around as we generate new mosaics.
Things are very much at the throwing Axe’s around and seeing what happens stage, but everything is working well enough that I can get back to some examples where I am exploring data.
There’s also a plan to allow Ball’s to set the mosaic and have Axe’s turn up with meta data based on the mosaic, so a Ball could consult the meta data and decide accordingly what it should do with the Axe.
Between the hacks and the asynchronous nature there are lots of rough edges, which in turn throw up some interesting images.
If you press n it will take you to the next object in the farm. Check the console to see what it is.
To start it running, press R, but before you do that you might want to press i which allows you to browse and change the attributes of the objects.
It is sort of like a debugger if you like.
I want to be able to edit matplotlib.rcparms. I am still hoping the validators in rcsetup will prove useful here.
I see ValidateInStrings has a valid attribute with the set of valid strings. Now I just need to find a way to make it all rotate.
But what about the table?
Between Legends, Axes labels, plot titles, mosaics of axes, plot lines and images, there are a lot of dimensions to use to explore data.
For now, my tour of matplotlib
2021/10/21
tldr: matplotlib already has a solution to everything.
For the last few weeks I have been working on trying to simplify the blume.magic module.
I use the word magic, not because it is, but it contains parts of the code put together with just enough to boot-strap some sort of interface that I can start to experiment with.
The idea was to have a bunch of objects, not knowing too much about each other, passing messages between each, other, asynchronously.
Using matplotlib to create images.
I have decided to take the plunge and switch things around a little. In particular, to just use the built in FigureCanvas from matplotlib to display images.
At the same time I am experimenting with simply making magic.Ball, inherit from matplotlib.artist.Artist.
This opens up a lot of existing matplotlib infrastructure. One area I plan to explore at some point is the rc setting infrastructure.
Meanwhile, the part I have been focussing is on is the passing of messages between artists.
Up to now blume each object has only had two queues that the system manages, stdin for incoming messages and stdout for outgoing.
This has all been achieved by magic.RoundAbout with a lot of help from a Shepherd and friends. There is some code that allows for arbitrary named queues, but the Shepherd does not watch those.
My plan is to have a network of objects for each queue name. Each edge being a queue.
I’m aiming to have a networks of objects for each class of messages.
You can see some of this in the GeeFarm and Shepherd which both have graphs (from networkx, actually the same graph).
The Shepherd also has a path attribute, that is a list of artists to which to send keyboard input to. This is all managed by the magic roundabout, in so far as that is where each object stores the dictionary of keyboard events and corresponding functions or coroutines to call when that event happens.
This gives me another reason to re-visit the matplotlibrc handling. This is precisely where matplotlib stores bindings between keyboard events and functions to call.
Separating this from the code could be a really good step. I am sure there are some more hidden gems that can be of use.
async
The magic part of the project has been an exploration of using python’s relatively recent (3.6?), async features.
At the core, is David Beazley’s curio. In particular, the UniversalQueue, which has some genuine magic that allows it to bridge the async and normal worlds.
In other words, you can pass the same UniversalQueue to this function and co-routine and they both successfully put 100 on the queue.
- ::
- def func(uq):
return uq.put(100)
async def coro(uq):
return uq.put(100)
The joys and trials of backends
This may sound ironic, but one of the reasons I originally went with a Tk backend is I wanted it to be easy to support other back ends.
The blume.teakhat module is a simple Tk window that just displays images and passes keyboard events to a function of my choosing.
The idea was that at this level, blume just needs grids of numbers, maybe with three or four layers, for red, green, blue and alpha.
Now, ax.imshow more than handles this for us.
The next layer, a magic.Carpet just lays images in square grids. blume.mosaic has the beginnings of a new approach, using the subplot_mosaic.
I’m also experimenting with constrained layout, which I am hoping to co-opt at some point to layout tables. Maybe even tables where every cell is a set of axes.
And that it shouldn’t be too hard to write something to do that given another backend.
One backend I am thinking about is a pixel grid such as a sense hat on a raspberry pi. The Sense Hat, or `astro pi`_ also has a joystick which can generate events to control everything. This was another reason I am trying to avoid specifying what events do what.
Which brings me back to magic roundabouts and event routing.
2021/09/01
I have been on a bit of a tour of parts of matplotlib that are concerned with laying out rectangles in grids.
It is a common problem, legends, tables, grids of plots and more recently mosaics too.
Each approach has a different focus, and each has some features very specific to the use case.
The blume.legend module is where I am trying to combine some of these ideas. Together with blume.examples.legendary where much of the fun is.
For a while, the plan was just to use the objects from matplotlib.offsetbox, also used by matplotlib.legend.
This takes a nice approach to scaling of text by having artists scale the size of their drawings by the font size in points. For example, if you want to place padding around some text, make that padding a multiple of the fontsize and all should be good.
The recent new arrival of subplot_mosaic introduces some powerful ways to describe the subplots you wish to see.
It allows mosaics of axes to be created. In addition, each cell of a mosaic can be its own mosaic, and so on ad-infinitum, or at least to some recursion limit.
So we can now have tables, where every cell of the table is, in fact, an entire axis.
I think what I need at this point is some combination of the offsetbox magic with the mosaics and it should be possible to make some very interesting tables.
2020/12/03
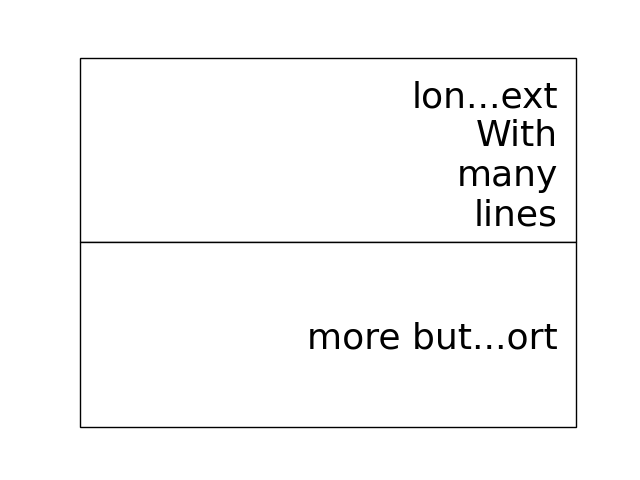
I started work on a blume.taybell.table function, with the same interface as the current blume.table, but some additonal tricks.
The goal is to come up with a way to specify the maximum string-length to display, with ellipses used if the string is too long.
I have been using blume.examples.shortify to test the code. Still buggy, but I love that brief moment of joy when the code runs and the output, whilst not what intended, is better than expected:
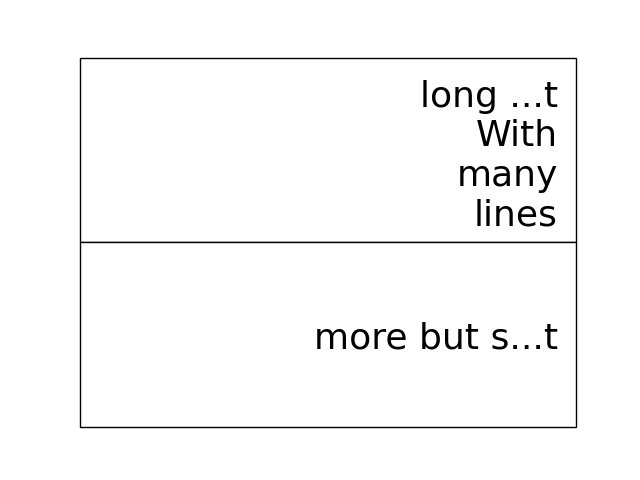
Fixed the bug, ruined the image:
Fixme?
Look for white space to delete?
Camelcase while we are at it?
Interactive Magic
it has mainly been a period of small improvements to the blume.examples.ocixx module.
This module downloads and plots data from the Ottawa Covid Database, also known as the COD. This is a database of Covid 19 cases in the Ottawa area.
See comments in the ocixx code for more information on the data sources.
There are a handful of tables available and they are generally updated once a day.
The code now downloads new data, compares to see if it has changed, commits to git if so.
It then spins through all the commits and plots each version of each variable in the file.
It is also using a magic spell to cast data and attempt to fill in missing values.
Cosmology
There has been a lot of news from on gravitational waves with a number of announcements relating to observations in the third observational run. See waves.rst for more information from the key papers.
I read something this week that the black hole at the centre of our galaxy is deemed to be 2000 or so light years nearer to us than had previously been thought, based on observations from the Gaia project.
I am wondering if this will in time put strain on the idea that Sag A* is indeed at the centre of our galaxy.
2020/09/02
September. guide.rst for a longer version.
2020/07/28
So what’s happening with this table thing?
The project has evolved into an exploration of all things table.
It turns out everyone has a table, so the project is looking for common themes.
How to build tools that make it easy to explore tables of data?
For now there are a few examples here.
Once you have blume installed you can run most modules from the command line:
python3 -m blume.mb -h
The -h option gives you help, showing options for the module
Most modules are using the blume.magic to display matplotlib hplots.
The magic is allowing everything to run asynchronously. It is partly an opportunity for me to explore asynchronous programming.
Recent work has been on the blume.gaia, blume.gw and blume.mb modules.
Gaia is a module to download and display data from the Gaia mission surveying our galaxy.
The gw module plots gravitational waves for random sized black hole mergers.
mb is the obligatory random Mandelbrot generator.
In other news, I just discovered the einsteinpy project. This looks like it will be a great help as I continue to explore U is for universe. See https://docs.einsteinpy.org for more on Einstein.
2020/03/16
With ski hills closing throughout the land I find myself back in blume land, sooner than expected.
It looks like I may be back here for a while.
As I expected not much has happened here in the last couple of months.
During that time there has been a steady stream of articles about interesting discoveries across the universe.
Black holes colliding, the size of a neutron star, a blazar likely a billion solar masses some 12-13 billion light years away?
Often, each new observation creates new puzzles.
Now I am back I plan to focus on the U for universal for a while.
My immediate goal is to try to explain the work of Colin Rourke, and his book, “A new paradigm for the universe”.
It is a wonderful book that links topics from gamma ray bursts to black holes, the centre of our galaxy, the cosmic microwave background and Einstein’s general theory of relativity.
It suggests that both dark matter and the big bang theory are critical mistakes in our understanding of our universe and is able to explain galactic rotation curves without the need for dark matter.
2020/02/03
It is winter in the frozen north.
That means spending a lot of time teaching people to ski and not so much on other projects, blume included.
There has still been time to think more about tables, in their various disguises.
The meaning, if any, of the letters of blume is evolving. What follows is an update, letter by letter.
Better or Basic
A simple interface to view images (matplotlib plots) produced by objects connected together by a graph of asychronous queues.
View the queues.
Switch things on and off.
Once this is working, explore the universe and our planet.
Little
The aim is to keep the code here to a minimum. A few thousand lines.
I have tried to focus on tables as lists of dictionaries or dictionaries of lists.
But then there are the special keys: time stamps, locations, latitudes and longitudes.
Right ascension, declination too.
Relative velocities and central masses.
Grids. Tables as grids and grids of global data.
healpix data, as used by the LIGO project to give heavenly maps of probable source of waves in space time.
Did someone mention little?
Universal
Something that is, or appears to be everywhere.
I am on a bit of a cosmological diversion thanks to the wonderful work of Colin P. Rourke. In particular, his book, A new paradigm for the universe [1]
His book has some mathematica code that allows you to simulate galactic rotation curves, using the mathematics of the book.
The blume.cpr module is an attempt to re-implement that code in python.
At this point I am just missing a table of some sort from Colin’s Mathematica code, but I think I can get by with lists of dictionaries, or is it dictionaries of lists?
So a tenuous link with the blume.table.
Matplotlib
So tables of data and blume.table just one way to display it with matplotlib?
This is rather different to the blume.table, which currently is only concerned with displaying a grid of values.
Engines
This list is evolving. The aim is if you are just here for the blume.table that should work without additional dependencies.
The cost here is modules that require the packages below. I think of them as engines, as in most cases they provide a whole eco-system of tools.
Since we have matplotlib we also have numpy and python-dateutil too.
curio
For everything async and await.
healpy
This is a magical format for storing spherical data.
A list of pixel values, with each pixel covering an equal area of some sphere.
It includes healpy.sphnfunc, a collection of tools to do spherical harmonic analysis of data, for which the format itself is ideal.
Other data sources tend to give a grid of latitudes and longitudes, which gives higher resolution at the poles.
It has a nested data format that is efficient for changing resolution.
It uses matplotlib to do plotting too, so it is good to have around on this adventure.
Pandas
For another take on table there is pandas.DataFrame.
pandas itself is a whole ecosystem, with time-series plotting and more and once more, python-dateutil.
Whichever way blume goes, I expect it will have a to_pandas_data_frame somewhere.
I like pandas very much. Like healpy it uses matplotlib to help with plotting.
astropy
Tracking the solar system. It’s own system of units too.
And low and behold, an astropy.table.
astroquery too.
Road and rail blocks
As I write code I go through periods of feeling blocked. I am not happy with some aspect of the code, but I need to change something, but that is likely going to make things worse unless I can figure out what the real problem is.
And where the solution belongs.
Assigning events to keyboard actions
I have spent a disproportionate amound of time thinking about this part of the user interface side of things.
I am focussing on keyboards and wanting to keep things simple, so the code generally just maps a key to a co-routine.
Does not feel like it should be part of this code at all, the code just needs to advertise what co-routines are available for interactive use and let some other tool deal with what events trigger what?
Maybe the code just hints which co-routines are more likely to be called? Or provides a word to describe it?
But anything that is used regularly will likely need to be predictable.
I am wondering if this can be done in a way that isn’t annoying: you have to re-teach the computer every time you play?
Without persisting any information from one process to the next?
How to let the user navigate their way?
Magic roundabouts?
Directed graphs of co-routines sharing data with queues.